Your 2026 SEO Data Is Lying: The Vanity Metrics Now Sabotaging Revenue
The rankings chart was green. Traffic was up 35% year over year. The slide deck practically glowed. And halfway through the quarterly review, the CFO asked the only question that ever really matters: so where’s the money?
Silence. Because the honest answer was that nobody knew, and the dashboard everyone had been staring at for three years wasn’t built to say. That gap — between metrics that look like success and revenue that actually shows up in the bank — is the story of SEO in 2026. Most of the numbers we grew up trusting have quietly stopped meaning what we think they mean.
The metrics didn’t lie on purpose. Search changed underneath them.
For twenty years, average keyword position was a reasonable proxy for business outcomes. Rank higher, get more clicks, get more customers. The chain held. Then AI Overviews landed on top of the results page, zero-click searches became the majority, and a growing share of queries started getting answered before anyone ever reached a website. The proxy broke, but the reporting didn’t notice.
Here’s the uncomfortable part. A #1 position on an informational query can convert at essentially zero, while a keyword sitting at position seven on a high-intent commercial term quietly pays for the whole channel. Position alone can’t tell those two apart. It treats them as identical wins. That’s not a rounding error — it’s the difference between a report that guides strategy and one that flatters it.
The worst offenders, ranked by how convincingly they mislead
Not every soft metric is equally dangerous. The truly harmful ones are the ones that look most like progress. Raw organic traffic is the classic example. One team I’d point to grew organic sessions 35% and still couldn’t trace a dollar of new revenue to it, because five thousand low-intent visitors don’t outperform five hundred buyers. They just cost more to serve. The inverse happens too: aggressive content pruning that drops total traffic while revenue climbs, because what got cut was never going to convert anyway.
Impressions might be the most seductive number on the entire dashboard. A million impressions on “what is SEO” reads beautifully in a monthly summary and means almost nothing commercially. Search Console won’t segment those impressions by intent in any way that helps you, so the total becomes a vanity figure dressed up as reach. Domain authority belongs in the same bucket — it’s a third-party score no search engine actually uses, yet teams still set goals around moving it.
Then there are the metrics that aren’t wrong so much as meaningless in isolation. Bounce rate with no context. Raw keyword counts that manufacture an illusion of scale. An obsession with Core Web Vitals that pulls engineering time away from anything tied to ROI. None of these are useless data points. They’re useless headline numbers, and the mistake is promoting them to the top of the board.
What AI Overviews actually did to your click-through rate
The click-through collapse is real and worth sitting with. When an AI summary appears above the organic results, click-through on those results drops sharply — and a meaningful slice of AI-summary searches now end without a single click to anyone. The search engine answered the question in place. Your perfectly optimized page never got the chance to.
Query behavior shifted alongside it. People used to type three or four words; now they hold entire conversations, firing off twelve-, twenty-, twenty-five-word questions at an assistant and refining from there. Tracking a handful of short head terms in that world tells you less and less about how your audience actually searches. The map stopped matching the territory.
But here’s the twist almost nobody saw coming, and it’s the reason this isn’t a doom story. The visitors who do arrive from AI-driven search tend to convert at dramatically higher value and stick around longer. Sessions go down; quality goes up. If your reporting only counts sessions, you’ll read a genuine improvement as a decline and pull budget from the exact channel that’s starting to work.
Measure the two things search actually became
So what replaces the old dashboard? Two questions, really. First: for the rankings that still map to intent and money, are you holding and gaining ground? Second: when an AI model answers a question in your category, does your brand get named — or does a competitor?
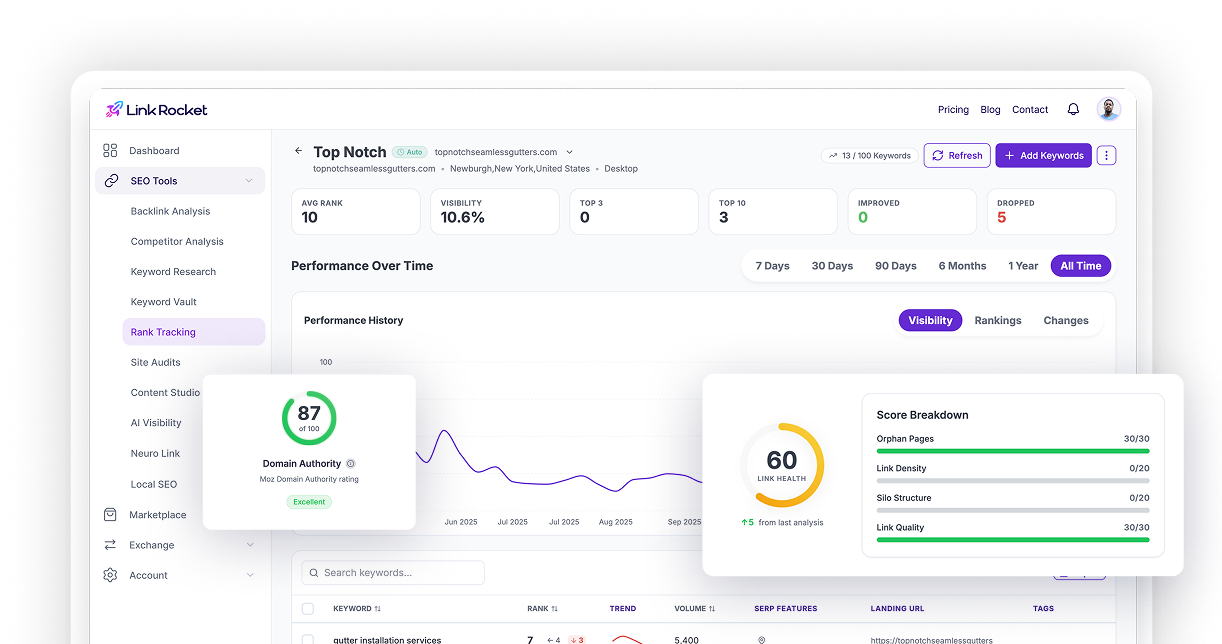
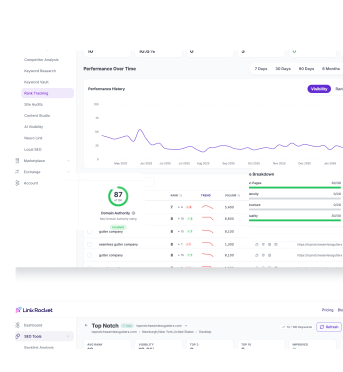
The first question is narrower than it sounds, and that’s the point. You don’t need to track every keyword you’ve ever ranked for. You need to track the commercial and high-intent terms where a movement of a few positions changes revenue, and you need to see them over time rather than as a single Monday-morning snapshot. This is exactly the job Rank Tracking is built for: daily position checks per project, a visibility score that weights your higher-ranking keywords more heavily instead of averaging everything into mush, and keyword-level history that shows which URL Google is actually choosing for a term and whether your changes moved it. It also records SERP features — whether a given keyword earned you a Featured Snippet or put you inside an AI Overview — so “position 4” stops being a flat number and starts carrying context. Just know going in that Rank Tracking is a Pro-and-up feature; there’s no free tier and no Search Console hookup, so you’re looking at fresh daily checks rather than backfilled GSC history.
The second question is the one the old stack can’t answer at all, and it’s where AI Visibility earns its place on the dashboard. It submits the questions your audience actually asks to ChatGPT, Perplexity, Google AI Overviews, and Claude on a schedule, then captures each full answer, the sources it cited, and whether your brand or domain got a mention. Out of that you get a mention rate per query and a Share of Model score — think Share of Voice, but for the models that increasingly stand between your content and your customer. A citation graph shows which of your pages the models keep quoting and which competitors are showing up in your place. That’s a revenue-adjacent signal the traffic chart simply cannot produce.
| Vanity metric | What it implies | Measure instead |
|---|---|---|
| Average keyword position (all terms) | General “visibility” | Rank movement on commercial, high-intent keywords over time |
| Raw organic traffic | Growth | Conversions and revenue per intent segment |
| Impressions | Reach | Mention rate in AI answers for buying-intent queries |
| Domain authority | “Site strength” | Citations by AI models and rankings that convert |
| Bounce rate in isolation | Engagement quality | Conversion quality by traffic source, including AI referrals |
Notice the pattern in that right-hand column. Every replacement metric answers “did this affect the business” instead of “did this number get bigger.” That’s the whole shift. You’re not tracking fewer things to be lazy; you’re tracking the things a CFO would actually recognize as an outcome.
Where this leaves your quarterly review
The dashboards that dominated the last decade weren’t dishonest. They were built for a search engine that mostly sent people to websites, and that engine is being replaced in real time by one that increasingly answers in place. Keeping the old scoreboard doesn’t make you rigorous — it makes you precise about the wrong things. The teams that will look smart in twelve months are the ones retiring their vanity metrics now, on their own terms, before a CFO does it for them.
Rebuild the report around two honest questions: are the rankings that map to money holding, and are the AI models that now mediate search naming you when it counts? Pair Rank Tracking for the first with AI Visibility for the second, cross-reference both against actual conversions, and let the impression counts fade into the footnotes where they belong. The charts might get less flattering. The decisions get a lot better.
Frequently asked questions
Are keyword rankings a useless metric now?
No — but average position across all your keywords is close to useless. A #1 spot on an informational query can convert at zero while a position-seven commercial term pays for the channel. The fix is to track rankings on high-intent, commercial keywords over time and weight them by value, rather than reporting one blended position number.
What is AI Visibility and why does it matter for revenue?
AI Visibility tracks whether your brand and domain get mentioned in answers from ChatGPT, Perplexity, Google AI Overviews, and Claude. As more searches get answered inside AI tools without a click to any website, being named in those answers becomes a direct path to your audience. It gives you a mention rate per query and a Share of Model score so you can measure presence the traffic chart can’t see.
Does LinkRocket Rank Tracking use Google Search Console data?
No. Rank Tracking runs its own daily position checks per project and does not integrate with Google Search Console. That means fresh daily data going forward rather than backfilled historical GSC numbers. It is a Pro-plan-and-above feature, so there is no free tier for it.
Why did my traffic go up but revenue stay flat?
Almost always because the added traffic was low-intent. Five thousand informational visitors do not outperform five hundred buyers, so raw session growth can climb while revenue sits still. Segment traffic by intent and measure conversions per segment instead of celebrating the top-line traffic number.
Which AI models does LinkRocket AI Visibility track?
ChatGPT, Perplexity, Google AI Overviews, and Claude. For each tracked query it captures the full answer, the sources cited, and whether your brand or domain was mentioned, then reports trends broken down by platform so you can see which models favor your content.
Rebuild your dashboard around what converts
Stop reporting numbers that only get bigger and start reporting the ones that move revenue. See the rankings that actually map to money with LinkRocket Rank Tracking, and find out whether the AI models now mediating search are naming your brand with AI Visibility.